

Part 1—Why are PDP options declining for Medicare beneficiaries?
By Rachel Schmidt and Erica Socker
When beneficiaries first become eligible for Medicare and during each year’s open enrollment period, they have the opportunity to decide whether to get coverage through traditional Medicare (TM) or a Medicare Advantage (MA) plan. Although that decision involves many factors, one key consideration is how they will get prescription drugs. Beneficiaries who use TM typically enroll in a stand-alone prescription drug plan (PDP), while beneficiaries who choose MA usually have drug benefits as part of their MA prescription drug plan (MA-PD).
To continue offering beneficiaries a meaningful choice between TM and MA, policymakers need to ensure that both PDPs and MA-PDs are available and affordable. But currently, prescription drug coverage through PDPs is substantially more expensive than coverage offered through MA-PDs, and there has been a steep drop in PDP availability. In this blog, we review how:
- Beneficiaries in TM face higher premiums and declining numbers of PDPs;
- Part D’s redesign and other factors have led to higher spending;
- Policy actions have moderated premium increases for beneficiaries, but only temporarily; and
- MA’s payment system offers MA-PDs a competitive advantage over PDPs.
A subsequent blog will discuss policy options for sustaining the PDP market and their tradeoffs.
Beneficiaries in traditional Medicare have higher premiums and fewer plan options
Most stand-alone PDPs are more expensive than getting prescription coverage through MA-PDs. In 2026, PDP monthly premiums average $36 but can range from zero to well over $100 for plans with enhanced (basic plus supplemental) benefits. Most enrollees in MA-PDs have enhanced benefits and pay an average of just $8 per month; 75% of enrollees pay no premium at all. MA-PDs can offer zero- or low-premium drug coverage because they can use a portion of the MA payments they receive from the federal government to buy down Part D premiums.
Over the last few years, beneficiaries in TM have seen a steep drop in choices among PDPs. Between 2023 and 2026, the available number of PDPs fell 55% from 804 to 360 plans. In 2026, while the average beneficiary still has a choice of 11 PDPs, that number is down from 24 in 2023. The number of PDPs qualifying as benchmark plans (in which beneficiaries who receive Part D’s low-income subsidy (LIS) can enroll with no premium) also fell by more than half between 2023 and 2025 but remained fairly stable between 2025 and 2026. LIS beneficiaries in Texas and Florida only have one benchmark PDP available; the average beneficiary has three.
Part D’s benefit redesign and drug trends have led to higher spending
Among other important changes, the Inflation Reduction Act of 2022 (IRA) restructured Part D in two major ways:
1) It increased the generosity of Part D’s standard benefit, improving affordability for many beneficiaries but also leading to higher drug spending; and
2) It required plans to bear more of the financial risk for their enrollees’ drug spending, which occurred at the same time that prescription spending became harder to predict.
A more generous benefit coincided with higher brand-name and specialty drug spending
An important goal of the IRA was reducing beneficiaries’ exposure to high out-of-pocket (OOP) costs for drugs. Prior to 2024, enrollees had to pay 5% coinsurance for each prescription once they reached Part D’s catastrophic threshold, amounting to thousands of dollars in additional OOP spending for certain high-priced medications. The IRA eliminated Part D enrollees’ cost sharing above the catastrophic cap, and in 2025, lowered the cap to $2,000 ($2,100 in 2026). In defining the catastrophic cap for this purpose, the value of supplemental benefits is newly being counted towards that cap. As a result, enrollees in plans with enhanced coverage can reach the threshold with accumulated cost sharing much lower than $2,100. One recent analysis found that non-LIS enrollees in enhanced plans who reached the cap paid an average of $900 OOP in 2025, though they sometimes pay higher monthly premiums to enroll in these plans.
These changes provide much greater financial protection for beneficiaries with high drug spending but raised benefit spending and put upward pressure on Part D premiums. Between 2024 and 2025, the share of enrollees who reached Part D’s catastrophic phase grew from 8% to 22%. Those individuals faced lower OOP costs, improving their access and potentially their adherence to drug therapies. In response, non-LIS beneficiaries increased their drug spending for both brand-name and high-priced specialty drugs. Some of that increase reflects broader use among enrollees previously deterred from filling prescriptions by high cost sharing; some may also reflect unnecessary use of high-priced drugs when alternatives are available. The underlying trend toward expensive specialty drugs and the rapid growth in the use of GLP-1s also contribute to Part D plans’ cost pressures.
Plan sponsors reacted to Part D’s new benefit structure in several ways. One reaction was to offer fewer enhanced PDPs, due in part to the reduced demand for supplemental coverage with a more generous standard benefit. A second reaction was that plans began increasing deductibles and using coinsurance for brand-name drugs rather than fixed-dollar copayments, potentially because enrollees would get credit for enhanced plans’ lower deductibles and copayments as OOP spending. This reaction is depicted in this example.
Part D plans took on more financial risk at the same time their costs became less predictable
Under Part D, Medicare makes two types of monthly payments for each enrollee’s basic drug benefits—a fixed-dollar (capitated) amount called the direct subsidy that is risk adjusted and, for enrollees who reach catastrophic levels of spending, a portion of the cost of each prescription filled (called reinsurance). The initial intention was that Part D plans would bear most of the risk for their enrollees’ spending through capitated payments, giving them a strong incentive to manage benefit spending. However, over time, Part D spending evolved in ways such that the majority of Medicare’s subsidies took the form of cost-based reinsurance, muting this incentive.
The IRA shifted greater financial liability back to Part D plan sponsors and introduced changes that increased plans’ uncertainty about their benefit costs, at least in the near term. In 2025, while keeping total subsidies stable, Medicare significantly reduced its reinsurance payments to plans and increased direct-subsidy payments. Plans began bearing risk on 60% of benefit spending for brand-name drugs above the OOP cap instead of 15%, at the same time that the cap was lowered, leaving plans uncertain about how many more prescriptions enrollees would fill.
Two other factors add to plans’ uncertainty. First, under the redesigned benefit, plans are now responsible for and bear risk on more benefit spending for LIS enrollees. Medicare previously paid for all of LIS enrollees’ benefits in the coverage gap other than their nominal copayments. Second, Part D began using the Maximum Fair Prices (MFPs) for the first 10 drugs selected for price negotiation in Medicare in 2026. Lower MFPs reduce benefit spending but may simultaneously reduce plan sponsors’ privately negotiated rebates with drug manufacturers. Selected drugs are also exempt from manufacturer discounts. The overall effect of these offsetting pressures on Part D premiums is unclear, but both make it more challenging for plans to predict benefit spending.
As a result, plans may bid conservatively (high). For 2025, uncertainty about the benefit redesign’s effects led plans to bid what they thought was conservatively on benefit costs. However, enrollees’ use of brand-name and specialty drugs was even higher than predicted, and plans likely bid too low, correcting upward in 2026.
Some of this uncertainty will diminish over time, as plans get more data on actual utilization and spending and gain experience with the use of MFPs, but it is possible some uncertainty will remain. Time will tell whether there is some flattening in spending growth in the next few years, or whether utilization increases will continue to push spending up.
Temporary steps have kept Part D premiums lower than they would be otherwise
Out of concern about how much premiums might increase after Part D’s benefit redesign, policymakers constrained premium growth through 2029 in the IRA. CMS also initiated a demonstration to limit PDP premium growth that will end this year. These measures moderated premium increases for beneficiaries over the last few years. However, this relief is temporary. Beneficiary premiums are expected to rise sharply in 2030, and some beneficiaries may see higher premiums this year with the demonstration ending.
The IRA capped all Part D premium increases through 2029
Policymakers capped annual increases in Part D’s base beneficiary premium (a portion of the average bid among PDPs and MA-PDs) to no more than 6%. This measure has constrained premium growth among PDPs and MA-PDs since 2024 and increased program spending by raising Medicare’s direct subsidy (see Figure 1). For 2027, the cap will limit the base beneficiary premium to $41 per month rather than the $94 per month it would be otherwise.
Figure 1. The IRA’s 6% premium growth cap increased Medicare’s direct subsidy and limited increases in the base beneficiary premium, but premiums will increase sharply in 2030 when it expires
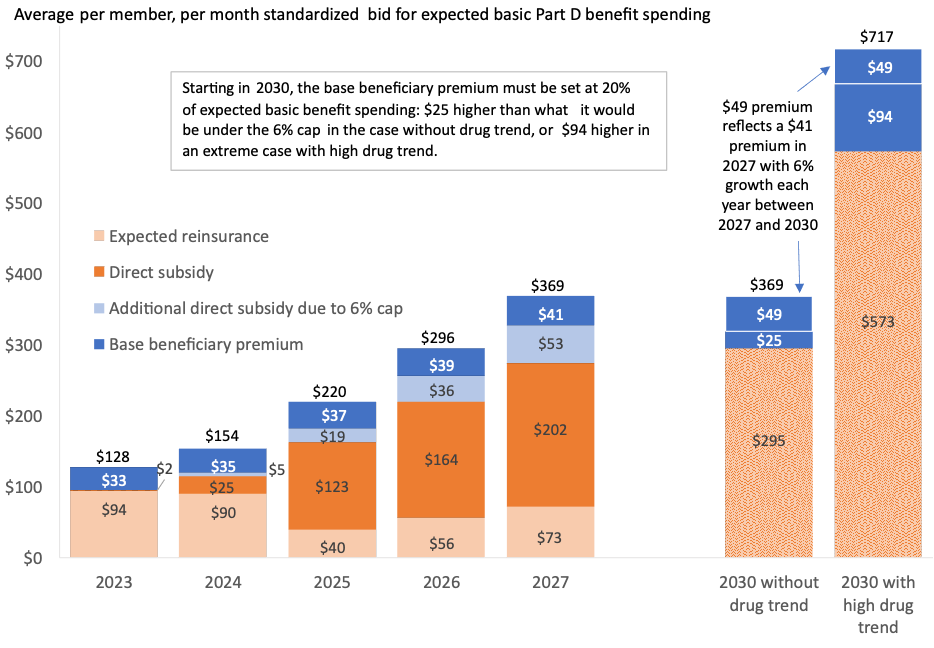
Notes: Sums may not add to totals due to rounding. Values for 2030 are for two hypothetical cases developed by actuary Katie Holcomb—one in which drug trend does not grow from 2027 levels and another in which drug trend between 2027 and 2030 grows each year by the same rate as between 2026 and 2027. The $49 base beneficiary premium in 2030 reflects 6% annual growth from the $41 base beneficiary premium in 2027.
Direct spending = the capitated, risk-adjusted amount Medicare pays Part D plans.
Base beneficiary premium = a portion of the average bids submitted by PDPs and MA-PDs; the actual premium enrollees pay for their Part D plan may differ from the base premium.
Reinsurance = Medicare payments to Part D plans to cover a portion of each prescription’s cost once beneficiaries reach the catastrophic phase.
Source: CMS, Office of the Actuary. Annual Releases of Part D National Average Monthly Bid Amount and Other Part C&D Bid Information.
In 2030, the 6% cap will expire and Part D’s base beneficiary premium must instead cover at least 20% of basic benefit costs compared with 13% in 2026 and 11% in 2027, resulting in a large premium jump. If the 6% cap continues to hold each year, the base beneficiary premium would increase from $41 in 2027 to $49 in 2030. One actuary’s analysis suggests that even before accounting for the trend in drug spending, to reach 20% of basic benefit costs, all monthly Part D premiums would automatically increase by $25 (see Figure 1). As an extreme assumption, if drug spending increased each year by the same annual rate as observed between 2026 and 2027 bids, in 2030, all Part D premiums would go up by $94 per month.
CMS’s premium stabilization demonstration focused on PDPs in 2025 and 2026
In 2025, CMS set up a premium demonstration program—ending after this year—that targeted additional subsidies to PDPs and not to MA-PDs to help stabilize that market. Participating PDPs received an additional $15 per member per month (PMPM) in direct subsidy payments could not increase premiums more than $35 per month, and had greater protection from higher-than-anticipated benefit costs through tighter risk corridors. In 2026, CMS modified the demonstration, lowering the subsidies to $10 PMPM, limiting PDPs’ premium increases to $50 per month, and returning to Part D’s usual risk corridors. CMS estimates that spending for the demonstration will total $9.8 billion. Another estimate puts it at $10.7 billion.
Payment system advantages for Medicare Advantage drug plans (MA-PDs)
The way MA-PDs are paid creates certain advantages for MA-PDs over PDPs that contribute to the instability of the PDP market. MA plans receive billions annually in payment rebates from the federal government, fueled in part by much higher federal subsidies to MA plans relative to TM, that they can use to lower their enrollees’ drug premiums and cost sharing. This gives MA-PDs an additional funding source not available to PDPs, and may undermine competition between TM and MA.
In 2026, MA-PDs put about $13 billion of their MA payments, or $51 PMPM, toward lowering their Part D enrollee premiums and cost sharing. The targeted subsidies that PDPs received through the premium stabilization demonstration are swamped by the additional resources MA-PDs have. Once the PDP premium demonstration ends in 2027, MA-PDs can continue to use their rebates to reduce the cost of Part D coverage and the differential between PDP and MA-PD premiums may grow wider. This difference may become especially evident after the IRA’s 6% cap on growth in the base beneficiary premium expires in 2030.
MA-PDs have had another advantage over PDPs in terms of how Part D payments are adjusted for risk. Relative to MA-PDs, PDPs have, on average, higher Part D benefit costs and lower risk scores. Some PDPs have also been more likely to incur financial losses because their payments, which tend to increase with risk scores, did not cover their expected costs. CMS has taken some steps to address this issue. Still, analyses by the Medicare Payment Advisory Commission (MedPAC) attribute some of the difference in risk scores to coding intensity—the tendency of MA plans to identify more diagnoses for their enrollees relative to a person of similar health in TM. Coding intensity and the accuracy of Part D’s risk adjustment system play a more important role now that more of Medicare’s Part D subsidies have shifted from reinsurance to risk-adjusted, capitated payments.
Implications for Part D
The changes and trends we described have likely improved enrollees’ access to high-cost drugs and strengthened financial protections by reducing OOP costs. At the same time, they have also contributed to a substantial increase in the number of enrollees who reach the OOP cap and increased Part D benefit spending. In 2025, two-thirds of Part D spending was in the catastrophic phase and not subject to any cost sharing, leaving Part D plans with limited tools to manage drug spending. CMS’s July announcement of the national average monthly bid amount for 2027 suggests that plans anticipate continued high growth in catastrophic spending.
Without additional policy changes, the implications of higher drug spending for Medicare beneficiaries and taxpayers are higher premiums, higher program costs, and potentially even fewer PDPs and qualifying benchmark plans. Having fewer PDPs to choose from could affect beneficiaries’ ability to find a plan that meets their needs, while the higher cost of PDPs could make it harder for beneficiaries to choose TM and further erode its ability to compete with MA.
In a subsequent blog, we will review a number of policy approaches to address the sustainability of the PDP market, including a discussion of their tradeoffs.